A CEO-Level Look at Why Charts Matter—and Where They Don’t
Executive Summary
As online investing has expanded, more investors have turned to technical analysis as a decision-making tool. Easy access to charts, indicators, and real-time data has made technical analysis a default language for many market participants.
From a CEO and capital-allocation perspective, technical analysis is neither magic nor nonsense. It is a tool—useful when applied with discipline, dangerous when treated as a shortcut. This article explains why online investors gravitate toward technical analysis, how it is properly used, and where its limitations lie.
1. Why Technical Analysis Appeals to Online Investors
Technical analysis focuses on price, volume, and market behavior rather than company fundamentals.
Online investors are drawn to it because it:
- Provides visual clarity
- Offers defined entry and exit levels
- Works across asset classes
- Fits short- and medium-term decision-making
CEO insight:
When information overload increases, investors look for structure. Charts provide that structure.
2. The Accessibility Factor
Modern trading platforms offer:
- Interactive charts
- Dozens of indicators
- Custom timeframes
- Instant execution
This accessibility lowers barriers—but also increases misuse.
Without a framework, more tools simply create more confusion.
3. What Technical Analysis Actually Measures
Technical analysis attempts to capture:
- Supply and demand dynamics
- Market sentiment
- Behavioral patterns
Price reflects collective decisions of all participants—institutions, funds, algorithms, and retail investors.
Charts are not predicting the future; they are organizing current information.
4. Common Technical Analysis Tools
Trendlines and Moving Averages
Used to identify direction and momentum.
Support and Resistance
Key price levels where buying or selling pressure historically appears.
Indicators
Examples include RSI, MACD, and stochastic oscillators.
Indicators do not create signals—they confirm context.
5. Why Technical Analysis Works—Sometimes
Technical analysis tends to work best when:
- Markets are liquid
- Participants respond similarly to price levels
- Risk is clearly defined
It is less effective during:
- Sudden macro shocks
- Low-liquidity conditions
- Structural regime changes
CEO framing:
Technical analysis works on behavior—not on certainty.
6. The Most Common Misuse of Technical Analysis
Online investors often fail by:
- Using too many indicators
- Ignoring higher timeframes
- Treating indicators as predictions
- Overtrading based on minor signals
More indicators do not equal more accuracy.
7. Technical Analysis vs Fundamental Analysis
This is not a competition.
- Fundamental analysis explains why an asset may be valuable
- Technical analysis helps decide when to act
Sophisticated investors often combine both.
8. Risk Management Is the Real Edge
Technical analysis provides structure for:
- Entry points
- Stop-loss placement
- Position sizing
Without risk control, even the best technical setup fails.
CEO rule:
A good chart without risk management is still a bad trade.
9. Timeframes and Investor Behavior
Shorter timeframes:
- Require faster decisions
- Increase emotional pressure
- Demand strict discipline
Longer timeframes:
- Reduce noise
- Improve signal quality
- Align better with investing goals
Choose timeframes that match your temperament.
10. Why Technical Analysis Fits Online Investing
Online investing is:
- Fast
- Global
- Information-rich
Technical analysis helps investors:
- Filter information
- Standardize decisions
- Reduce emotional reactions
Used correctly, it adds structure—not certainty.
11. When Online Investors Should Be Cautious
Technical analysis should not be the sole decision driver when:
- Valuations are extreme
- Macro risks dominate
- Liquidity is constrained
Ignoring fundamentals entirely increases long-term risk.
12. Building a Disciplined Technical Framework
A professional approach includes:
- Few, well-understood tools
- Clear rules for entries and exits
- Defined risk per trade
- Performance review over time
Consistency matters more than creativity.
13. Common Mistakes New Technical Traders Make
❌ Indicator overload
❌ Trading every signal
❌ Ignoring market context
❌ Abandoning systems too quickly
Most failures are behavioral, not technical.
Conclusion: Technical Analysis Is a Tool, Not a Shortcut
Online investors turn to technical analysis because it provides clarity in complex markets.
However, its value depends entirely on how it is used.
For serious investors and executives:
- Use technical analysis for structure
- Combine it with risk management
- Respect its limitations
- Avoid overconfidence
Technical analysis does not replace discipline—it demands it.
Word Count:
276
Summary:
Technology has not only allowed investors to trade online, but has provided them with the tools needed to analyze stocks like the pros.
Keywords:
Online Investors Turn to Technical Analysis
Article Body:
Technology has not only allowed investors to trade online, but has provided them with the tools needed to analyze stocks like the pros.
In fact, technical analysis has become more popular than ever over the last several years. Traders evaluate past price movements to help forecast a security’s future price.
Fundamental analysis, the alternative method of stock evaluation, relies on a stock’s intrinsic value and requires a broader understanding of industry conditions and how companies are managed.
But how do investors look at the data, and what exactly are the advantages of technical analysis?
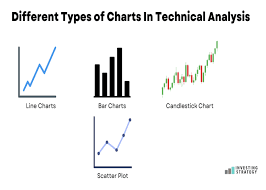
RushTrade, like many other brokers, provides candlestick charting as a technical analysis tool for their traders. Candlestick charts have been used for hundreds of years and are derived from a Japanese version used to analyze the price of rice contracts.
Like a bar chart, the daily candlestick line shows the market’s open, high, low and close of a specific day, but also uses color and shading to help clarify the range between the open and close of that day’s trading.
A big difference between the common bar charts and the Japanese candlestick charts is the relationship between opening and closing prices. Bar charts place more emphasis on the progression of today’s closing price from yesterday’s close. Candlestick chartists are more interested in the relationship between the closing price and the opening price of the same trading day.
Technical analysis methods work from the assumption that the market is more psychological than logical. Thus, candle patterns are essentially reactions of traders at a particular time in the marketplace. People often react en masse to situations, and this allows candlestick chart analysis to work.

Tinggalkan Balasan